
Multimodal Science: Text, Image, Graph, and Gesture
Section 6 of Chapter 4 — why scientific meaning is distributed across modes, and why gesture is the deepest of them

Open any scientific paper before you read it, and look. You see prose, but also figures, graphs, tables, equations — and if a scientist is presenting it, you see hands moving, arms sweeping, a body rotating to show direction. This is not decoration. The meaning of the paper is distributed across all these modes at once, each doing cognitive work the others cannot. We saw in the previous post that mathematics is its own language; here the lens widens to the full ensemble — and arrives at the mode we most often underestimate, the one where the body itself becomes the argument.
Open a scientific paper
Let us begin with something entirely concrete. Open any scientific paper — it does not matter much which one. Physics, chemistry, biology, ecology, cognitive science. Look at it before you read it.
What do you see? Text, certainly — paragraphs organized into sections: abstract, introduction, methods, results, discussion. But also figures: photographs, diagrams, schematic drawings, microscopy images. Graphs: scatter plots, line graphs, bar charts, histograms, heat maps. Tables: columns of measurements, statistical summaries, parameter values. Equations — in the body, set apart on their own lines, tucked into appendices. And if you are watching a scientist present the paper rather than reading it, you see something else again: hands moving, arms sweeping, fingers pointing, bodies rotating to indicate direction and orientation.
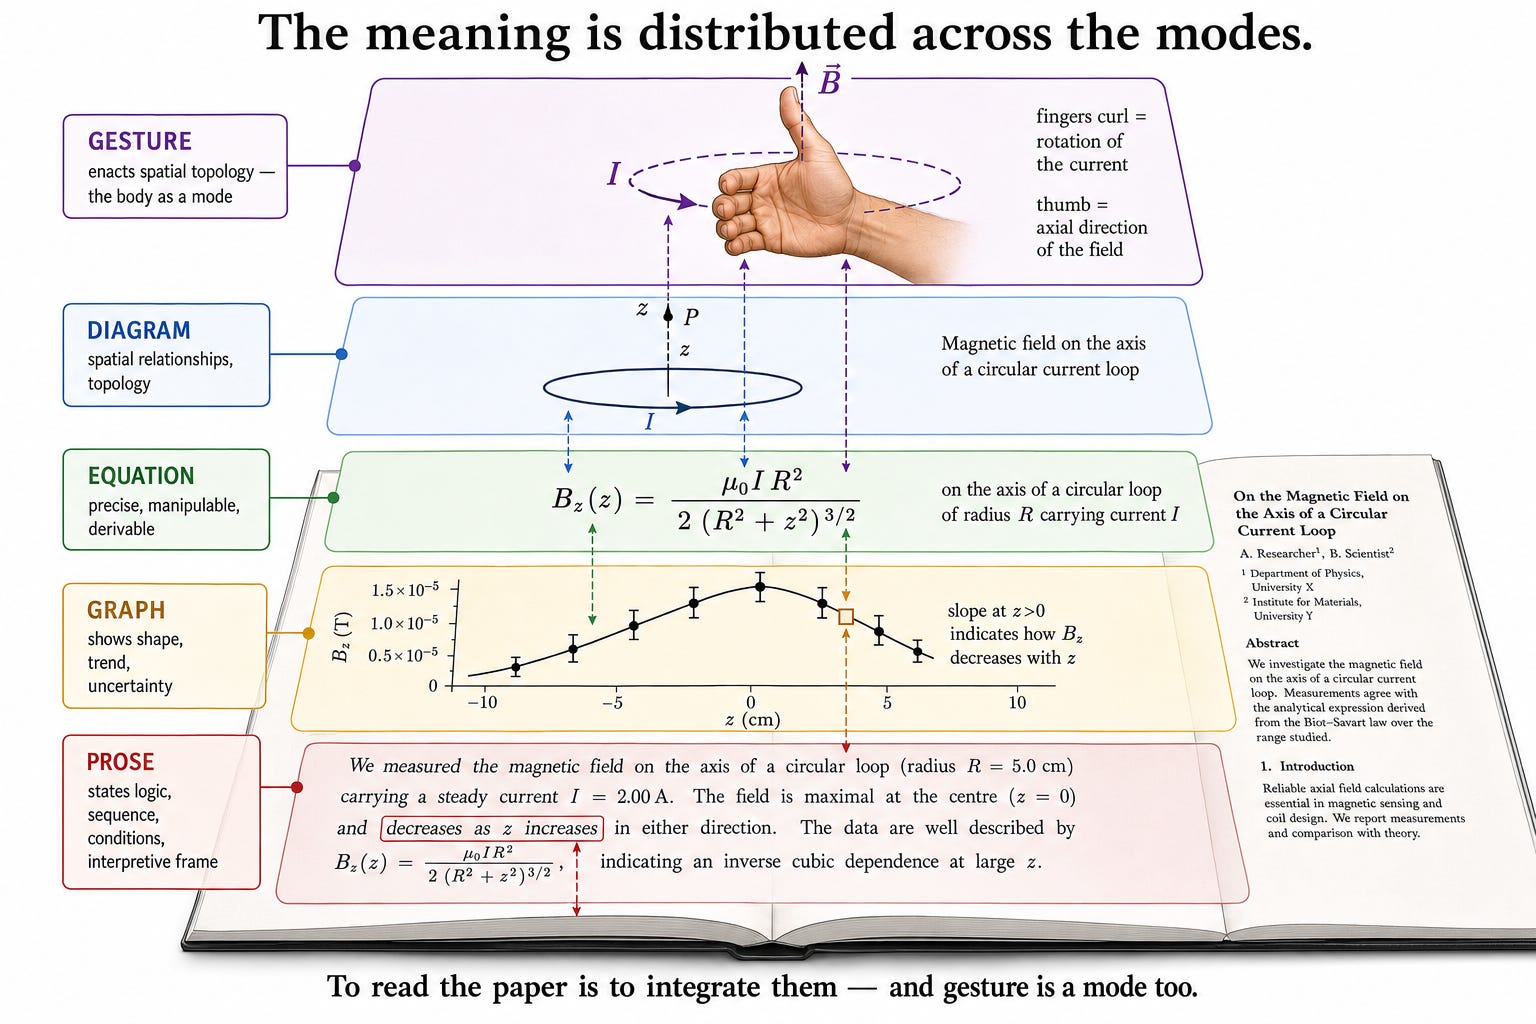
This is multimodal scientific communication, and it is not a stylistic choice. It is not that scientists could, if they wished, say everything in prose and have chosen to add pictures for variety. The figures, graphs, equations, and gestures are doing cognitive work the prose cannot do — and the prose is doing work the others cannot. The meaning is distributed across all of them simultaneously. To read the paper is to integrate them. This post asks why scientific communication is irreducibly multimodal: what each mode contributes, what each conceals, and what it demands of a learner to move fluently across them.
Lemke: the multimodal texture of scientific discourse
Jay Lemke, working at the intersection of linguistics, semiotics, and science education, was among the first to analyze scientific communication systematically as a multimodal practice. His central claim is deceptively simple: scientific discourse is not primarily verbal. It is a coordinated deployment of multiple semiotic systems — language, mathematical symbolism, visual representation, and action — each contributing meaning the others cannot provide, and each requiring the others to be fully intelligible.
The verbal and the visual, Lemke observed, are not parallel channels carrying the same content. They are complementary modes with different semantic affordances. A graph can show the shape of a relationship — its continuity, its rate of change, its asymptotes, its inflection points — in a single visual impression that would take many sentences to describe and that prose still could not fully capture. Prose can situate the graph in an argument — explaining what it shows, why it matters, what it rules out, how it connects to theory — in a way the graph alone cannot. Neither mode is sufficient alone. Together they carry a meaning that neither could carry separately.
The distribution of cognitive labor — a first inventory. Prose states the logical and argumentative connections between claims, establishes temporal sequence and causal direction, names the conditions under which results hold, and provides the interpretive frame within which data are read. Diagrams and images show spatial relationships, topology, and structural organization simultaneously, make visible the shape of distributions and the geometry of structures, and let the eye detect patterns, symmetries, and anomalies that sequential reading cannot reveal. Equations express quantitative proportional relationships with precision and manipulability, make inferential steps explicit and checkable, and enable the derivation of new results by symbolic operation. And gesture — we come to that carefully below, because it is the one most easily missed.
Lemke names the way meaning accumulates across modes thematic development. As the reader moves through a paper, the verbal text, the figures, and the equations are not presenting the same theme three times. They are developing it — each mode extending it in a direction the others cannot reach, each creating expectations the others partially fulfill. The reader who cannot integrate across modes is not reading a scientific paper imperfectly. She is reading something different from what the paper is. The paper, as a cognitive artifact, only exists in its multimodal totality.
Kress and van Leeuwen: the grammar of visual design
If Lemke gives us the functional analysis — what each mode does — Gunther Kress and Theo van Leeuwen give us something complementary: a grammar of visual representation. Their central claim is that visual communication is not arbitrary or merely aesthetic. It is structured. Visual representations have a grammar — a set of compositional principles that organize meaning spatially, just as syntax organizes meaning sequentially in language.
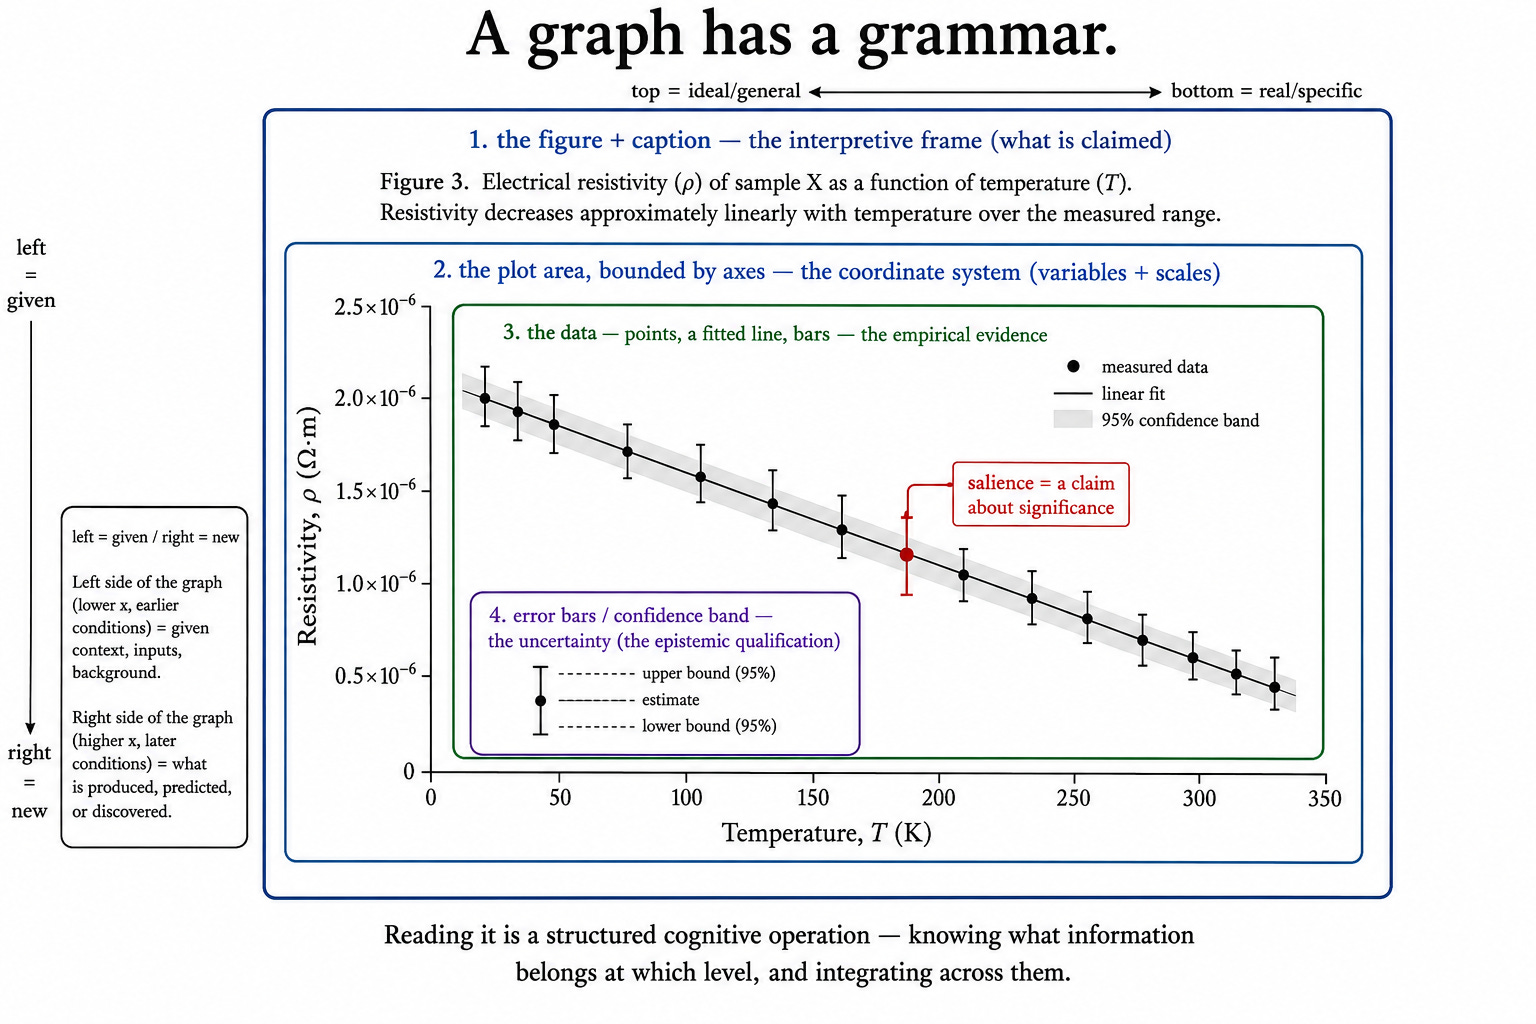
Several dimensions of this grammar bear directly on scientific images. The left–right axis, in Western visual culture, tends to carry a given–new distinction: what is placed on the left is presented as familiar, already established; what is placed on the right is presented as new, to be attended to. The top–bottom axis tends to carry an ideal–real distinction: the upper region presents the idealized or generalized claim, the lower region the specific, evidential, detailed support. Centre–margin organization places what is most important at the centre and subordinates everything else to the periphery.
Visual grammar in a scientific graph — nesting in action. Consider the anatomy of a standard graph. At the outermost level: the figure as a whole, with its caption. Nested within it: the plot area, bounded by axes. Within the plot area: the data — points, lines, bars. Within the data: error bars, confidence intervals, annotations. Each level carries different information at a different level of precision. The caption gives the interpretive frame — what the graph is claiming. The axes give the variables and their scales. The data give the empirical evidence. The error bars give the uncertainty — the epistemological qualification of the evidence. Reading a graph is not passive reception. It is a structured cognitive operation that requires knowing the nesting hierarchy and integrating across its levels. A reader who attends only to the data points and ignores the axis scales has misread the graph as fundamentally as a reader who ignores the subordinate clauses of a sentence.
Kress and van Leeuwen also draw attention to salience — the degree to which visual elements attract attention through size, color, contrast, positioning, or sharpness. In a scientific image, salience is not decorative. It is a claim about significance: the element made visually salient is being marked as the most important thing to attend to. When a micrograph highlights a particular cellular structure in false color, or a phylogenetic tree bolds a particular clade, the salience is doing argumentative work — directing the reader’s attention to the evidence the argument depends on.
This has a consequence easy to overlook in science education. Students who have not been explicitly taught the grammar of scientific visual representation are not neutral readers of scientific images. They may be attending to the salient elements without understanding why those elements are salient, or reading the spatial organization of a figure as arbitrary when it is in fact carrying meaning. Visual literacy in science is a learnable skill — and a teachable one. But it has to be taught explicitly, because the grammar is not transparent to the uninitiated reader.
The mapping demand: integrating across modes
We have now named what each mode does. But the most cognitively demanding aspect of multimodal communication is not reading any single mode — it is the integration across modes. And the primary operation integration requires is mapping.
When a paper presents a graph, a prose description of the same data, and an equation expressing the relationship the graph shows, the reader must map across all three: recognizing that the slope of the line corresponds to the coefficient in the equation corresponds to the rate of increase described in the prose. These are not three separate pieces of information. They are three representations of the same structure in three different registers. The reader who can map between them has understood the structure. The reader who treats them as independent is accumulating disconnected information.
Mapping across modes — Duval extended. In the previous post we examined Duval’s concept of register conversion within mathematics: moving between algebraic, diagrammatic, and tabular representations of the same object. Multimodal science extends this demand beyond mathematics to the full range of semiotic modes. The student reading a paper on population dynamics must map between the prose description of predator–prey relationships, the differential equations governing the population model, the phase-plane diagram showing the system’s trajectories, and the time-series graphs showing oscillating population counts. Each is a different register. Each reveals different structure. The system is only fully understood when the reader can navigate between all four and recognize the same underlying dynamics in each. This is a network of representations — multiple nodes, each connected to the others by mapping relationships, each illuminating a different facet of the same phenomenon. Scientific understanding, at its deepest, is fluency in this representational network.
The mapping demand has a specific implication for science education, one that connects to the Zone of Proximal Development we discussed earlier in this chapter. A learner who can work fluently within one mode — manipulate equations, or read graphs, or follow a prose argument — but who cannot map between modes is operating at a level of scientific literacy short of what practice actually requires. The ZPD for multimodal integration is a distinct and demanding zone, one that requires explicit scaffolding, not just exposure to multimodal texts.
And the direction of difficulty matters. Lemke’s empirical work in science classrooms found that students typically found it easier to move from equation to graph than from graph to equation — easier to verify that a given graph is consistent with a given equation than to construct the equation from the graph. This asymmetry is cognitively significant: it reflects the difference between recognition within a register and conversion between registers. The former is treatment; the latter is conversion, in Duval’s terms — and it is harder.
Gesture: the snapshot breaking through
And now we come to the mode most often underestimated — because it is the most embodied, the most fleeting, and the most difficult to include in a written text. Gesture.
Let me be precise about what I do and do not mean. I do not mean the general observation that people move their hands when they talk. That is true and interesting in its own right, but it is not the claim here. I mean something more specific: that there is a class of scientific gestures that are not illustrating a concept, not pointing at a diagram, and not performing a social function. They are enacting the spatial and dynamic structure of a physical phenomenon in a way no other mode can fully replace.
The right-hand rule is the paradigm case. Hold your right hand up for a moment — if you can — and perform it with me.
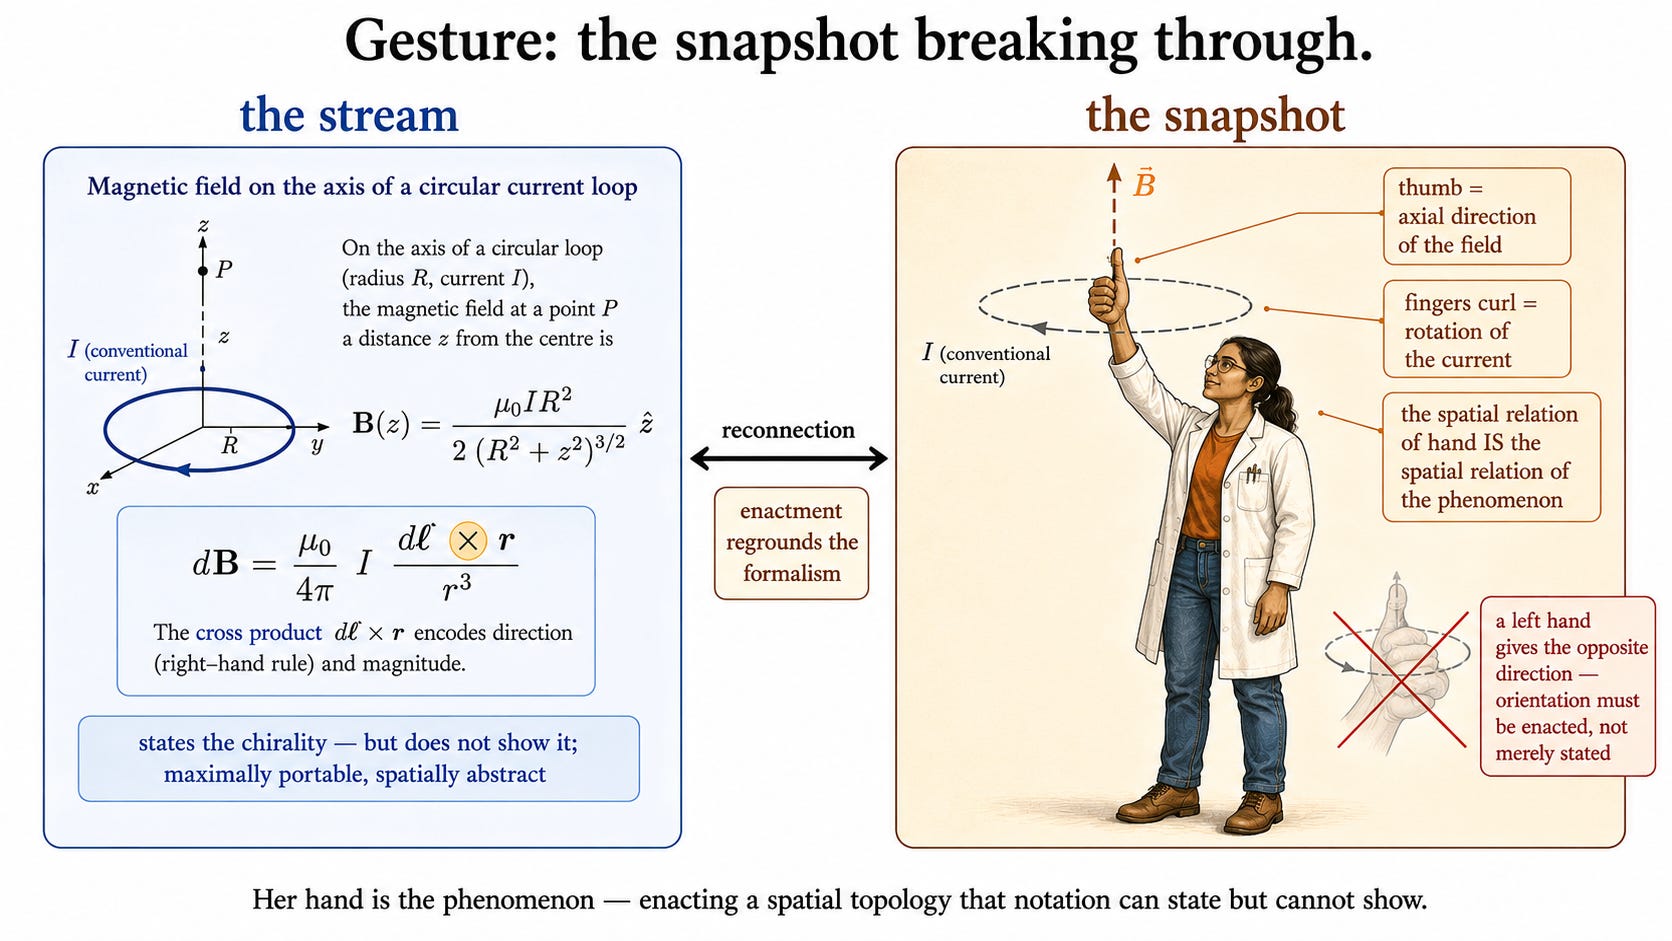
The right-hand rule — enactment, not illustration. Curl the fingers of your right hand in the direction of a conventional electric current flowing through a circular loop of wire. Your extended thumb points in the direction of the magnetic field the current produces — through the centre of the loop, perpendicular to the plane of the current. Now: what is your hand doing? It is not pointing at the phenomenon. It is not indicating a direction on a diagram. It is not a mnemonic for remembering which way the field points. Your hand is reproducing the topological structure of the electromagnetic relationship in three-dimensional space. The curl of your fingers maps the rotation of the current. The extension of your thumb maps the axial direction of the field. The spatial relationship between your curled fingers and your extended thumb is the spatial relationship between the current and the field. The hand is the phenomenon. Or more precisely: the hand is enacting the same spatial topology the phenomenon instantiates. And that topology has a specific feature — it is chiral. It is handed. It is not symmetric under reflection. A left-hand rule gives you the opposite direction. This chirality is a real physical fact, and it can be stated in an equation — the cross product in the Biot–Savart law — but the equation states the chirality without showing it. The gesture shows it.
Let us push on this, because it connects to something deep. The right-hand rule belongs to a family of physical relationships — all involving rotation, orientation, and chirality — where the body’s spatial competence provides a direct sensorimotor coupling to the abstract structure. Consider chirality in chemistry. A chiral molecule exists in two mirror-image forms — left-handed and right-handed — that are chemically identical in most respects but rotate polarized light in opposite directions and interact differently with biological systems. The definition of left-handed and right-handed for a molecule is not metaphorical. It is literal: the molecule’s spatial configuration is compared with the configuration of an actual hand. The hand is the reference standard, not an analogy for it.
Or consider torque. When a physicist explains torque — the rotational effect of a force — she does not merely state the formula: torque equals the cross product of the position vector and the force vector. She picks up a wrench, or mimes doing so, and turns it. The direction of the torque — perpendicular to both the lever arm and the force, by the right-hand rule again — can be stated in the notation of the cross product. But the felt sense of the wrench turning, of the resistance in the bolt, of the direction in which the force is applied: this is the snapshot from which the formal representation was derived, and to which it must be reconnected if the formula is to be more than a rule for getting the right answer.
The Coriolis effect offers a third case. The apparent deflection of moving objects on a rotating Earth — to the right in the Northern hemisphere, to the left in the Southern — is notoriously difficult to grasp from a description alone. Physicists and meteorologists who teach it regularly resort to enactment: spinning a globe, rotating their own bodies, placing themselves imaginatively at the North Pole and watching a projectile travel away across the rotating surface. The body enacts the rotating reference frame. The enactment provides the spatial intuition the formula can then formalize.
Gesture and the snapshot–stream architecture. Recall the snapshot–stream asymmetry. The snapshot is the holistic, simultaneously present structure of meaning constituted in the agent’s ongoing sensorimotor engagement. The stream is the sequential, rule-governed serialization of that meaning into a transmissible signal. Scientific notation — equations, logical formalisms, algebraic expressions — is the purest form of the stream: maximally schematic, maximally portable, maximally explicit. But it pays a price: it abstracts away from the spatial, dynamic, orientational structure of the phenomena it represents. Gesture is the snapshot asserting its indispensability. When a physicist performs the right-hand rule, she is not retreating from the formalism to a crude approximation. She is reconnecting the formalism to the spatial topology from which it was derived — and in doing so providing what the formalism alone cannot: the sensorimotor grounding that makes the abstract structure inhabitable rather than merely manipulable. A student who can apply the right-hand rule formula without being able to perform the gesture — without being able to enact the spatial relationship in three dimensions — has the stream without the snapshot. She can get the right answer. She does not yet understand why it is right.
There is a research tradition in cognitive science — associated with David McNeill, and in science education with Wolff-Michael Roth — that has documented gesture as a meaning-making resource in scientific explanation. What this research consistently finds is that gesture is not redundant with speech. It carries information the speech does not — spatial, dynamic, topological information — and listeners process gesture and speech as integrated, complementary channels. When gesture and speech are placed in conflict — when a teacher says one thing and gestures another — comprehension breaks down. This is the signature of a genuinely multimodal cognitive system, not a system with a primary verbal channel and an auxiliary visual one.
For science education, this means the embodied, gestural dimension of scientific explanation is not an optional supplement to the formal one. It is a cognitive necessity — particularly for the class of phenomena involving orientation, rotation, chirality, topology, and dynamic spatial structure. These phenomena have a spatial body that notation can only partially capture. The gesture enacts that body. And enactment, as we saw through Noë and O’Regan, is prior to representation: we perceive by acting, and we understand spatial structure by reproducing it in the body before we can formalize it in a symbol.
Multimodality and the mediation ecosystem
Pull back to the level of the chapter and ask: what does the multimodal character of scientific communication tell us about the mediation ecosystem introduced at the chapter’s opening?
That ecosystem — language, formalisms, mathematics, inscriptions, diagrams, instruments, models, institutions — is not a set of parallel channels, each capable of carrying the full content of scientific knowledge. It is a set of complementary modes, each with its own expressive power and its own cognitive demands, that together constitute the infrastructure through which scientific knowledge is produced, communicated, and taught.
The modes are not substitutable. You cannot replace a graph with a prose description and preserve all the information. You cannot replace a gesture with a formula and preserve all the meaning. You cannot replace a diagram with a table and preserve the spatial relationships. Each mode is irreplaceable for what it does — and what it does is determined by its relationship to the phenomenon it represents and to the cognitive architecture of the agents who use it.
This means scientific literacy is not a single competence. It is a family of competences — each associated with a mode, each requiring explicit learning, each requiring integration with the others. A student fluent in mathematical notation but unable to read a graph is scientifically literate in one register and illiterate in another. A student who can follow a prose argument and read a graph but has no gestural or enactive access to the spatial phenomena being described has a gap that no amount of additional verbal or symbolic instruction will fill. She needs to enact — to use the body as a cognitive tool.
An open question to carry forward. If gesture enacts spatial topology that notation can state but not show — if the body provides sensorimotor grounding prior to and irreducible by symbolic representation — then what does this imply for the relationship between scientific understanding and the body? Is there a level of scientific competence that is necessarily embodied: that cannot be fully transmitted through the stream, that requires sensorimotor enactment to be fully acquired? That question opens the next chapter, where spatial cognition appears as the biological ground of all representational extension, and the body returns to the centre of the picture.
Take-home. Scientific meaning is never carried by a single mode. Text, diagram, graph, equation, and gesture each do cognitive work the others cannot — not redundant repetitions of one content but a distribution of cognitive labor across complementary representational systems. The deepest case is gesture: not illustration, but enactment. When a physicist demonstrates the right-hand rule, she is not pointing at the phenomenon — her hand is the phenomenon. The body enacts the spatial topology of the electromagnetic relationship in a way that notation can state but cannot show. The snapshot asserts its indispensability.
Next: “Language Games in Science: Wittgenstein, Kuhn, and the Limits of Translation.” We have examined what scientific language does — how it compresses, enables recursion, is formalized, operates across modes. In the final analytical post of the chapter we ask what happens when the language game changes: Wittgenstein on meaning as use, Kuhn on paradigm incommensurability, and the Agent–Agent vertex pushed to its institutional limit.
Image prompts used for this post. Try them on your own AI model and compare what it produces with our figures.
1. The multimodal page
Output format: PNG. Landscape, 18cm × 10cm. A single open scientific paper shown flat and "exploded" so its modes separate into labeled translucent layers floating just above the page, each layer a different mode of meaning. Bottom layer: a block of "prose" (paragraphs, tagged "states logic, sequence, conditions, interpretive frame"). Above it: a "graph" panel (a line curve with axes and error bars, tagged "shows shape, trend, uncertainty"). Above that: an "equation" panel (a compact formula, tagged "precise, manipulable, derivable"). Above that: a "diagram" panel (a labeled schematic, tagged "spatial relationships, topology"). Floating at the very top, partly outside the page: a "gesture" layer drawn as a whole human right hand in the right-hand-rule pose — the hand shown palm facing the viewer, the four fingers curling in the direction of a faint circular current loop drawn around the hand, the loop marked with a small arrowhead and labeled "I", and the thumb extended straight up through the centre of the loop along a labeled magnetic-field axis "B"; the curl of the fingers and the arrowhead on the loop must point the same way, and the thumb must point along B — tagged "enacts spatial topology — the body as a mode". Thin two-way mapping arrows connect a feature in each layer to the same feature in the others (the slope of the line ↔ the coefficient in the equation ↔ a phrase in the prose). Large caption above: "The meaning is distributed across the modes." Smaller caption below: "To read the paper is to integrate them — and gesture is a mode too." Clean schematic line-art; not photographic; NO brain icon — render the hand as a real embodied hand.2. The grammar of a graph
Output format: PNG. Landscape, 18cm × 10cm. One scientific graph drawn large, with its grammar made visible through nested labeled frames, like Russian dolls of meaning. Outermost frame: "the figure + caption — the interpretive frame (what is claimed)". Inside it: "the plot area, bounded by axes — the coordinate system (variables + scales)". Inside that: "the data — points, a fitted line, bars — the empirical evidence". Innermost: "error bars / confidence band — the uncertainty (the epistemic qualification)". Along the left edge a small vertical legend reads "left = given / right = new"; along the top edge "top = ideal/general, bottom = real/specific"; one data feature is highlighted in a contrasting color tagged "salience = a claim about significance". Large caption above: "A graph has a grammar." Smaller caption below: "Reading it is a structured cognitive operation — knowing what information belongs at which level, and integrating across them." Neutral schematic ink with one accent color for the salient element; clean line-art; not photographic; NO brain icon.3. Her hand is the phenomenon
Output format: PNG. Landscape, 18cm × 10cm. A single open scientific paper shown flat and "exploded" so its modes separate into labeled translucent layers floating just above the page, each layer a different mode of meaning. Bottom layer: a block of "prose" (paragraphs, tagged "states logic, sequence, conditions, interpretive frame"). Above it: a "graph" panel (a line curve with axes and error bars, tagged "shows shape, trend, uncertainty"). Above that: an "equation" panel (a compact formula, tagged "precise, manipulable, derivable"). Above that: a "diagram" panel (a labeled schematic, tagged "spatial relationships, topology"). Floating at the very top, partly outside the page: a "gesture" layer drawn as a whole human right hand in the right-hand-rule pose — the hand shown palm facing the viewer, the four fingers curling in the direction of a faint circular current loop drawn around the hand, the loop marked with a small arrowhead and labeled "I", and the thumb extended straight up through the centre of the loop along a labeled magnetic-field axis "B"; the curl of the fingers and the arrowhead on the loop must point the same way, and the thumb must point along B — tagged "enacts spatial topology — the body as a mode". Thin two-way mapping arrows connect a feature in each layer to the same feature in the others (the slope of the line ↔ the coefficient in the equation ↔ a phrase in the prose). Large caption above: "The meaning is distributed across the modes." Smaller caption below: "To read the paper is to integrate them — and gesture is a mode too." Clean schematic line-art; not photographic; NO brain icon — render the hand as a real embodied hand.The same stream (prompts) activates different snapshots (models) in different receivers (agents). Try the prompts above on your own AI model and compare what it produces with our figures.
This is “The Roots of STEM,” a series exploring the cognitive bases of science, technology, engineering, and mathematics. Subscribe to follow the arc from the body to the laboratory.